The Women’s Foundation of Boston seeks to empower women and girls around Boston. Most of their work involves collaborating with and funding other non-profit organizations that run programs in Boston. These events vary in topic, although they primarily focus on leadership and education. Our task is to visualize WFB’s impact on the community utilizing data that summarizes which organizations, programs, and participants have been helped. Our motivating question is: what is the overall impact on women of the Women’s Foundation of Boston?
We have data that is split into categories by Excel sheets. One is qualitative data indicating the impact of their programs over time, another is focused on STEM-related programs and their locations, another sheet shows demographic data for program participants, and another shows the total number of participants funded by the WFB as well as some demographic data. The data were likely collected from a mixture of external (surveying nonprofits to determine WFB’s impact) and internal (keeping track of programs and grants as they’re run and distributed).
The data provided to us by WFB tracks the impact of their funding on numerous programs. It contains demographic data on program participants, as well as individual program data categorized by program type and focus area. The data also contain some limited geographic data indicating the areas served by their programs.
The data subset we are using to address the prompt of showcasing WFB’s impact on the community includes data that shows the number of people in specific Boston organizations and programs that are funded. The data also gives insight into the specifics of these people within the groups, such as providing data for the number of people of specific races being funded in the program. For example, the data subset shows which participants in the specific program are white-funded, black-funded, Asian-American funded, etc.
The data cleanup process so far has included checking for null or missing values, which we didn’t find any of. We also looked for outliers in the data just for best practice purposes. While initially making the first Tableau visualization, we discovered that we needed to delete a few rows in order for the data to be properly visualized. We still have the original copies of the dataset as well as the newly edited ones. The data types are primarily quantitative with some nominal as well.
The main goal of the Women’s Foundation Boston is to visualize the impact of their organization based on the data provided. They want to show the donors who provide the grants to the organization where their money went and what impact their programs had. They would use these visualizations to market on social media as well as provide the knowledge to the general public. They would also use the visualizations to present to their internal board meetings to analyze trends over time.
It seemed like the interviewees, Patti and Annie, had a general idea of what they wanted as an outcome from our project. They gave us permission to use our creative freedom but still preferred to be kept in the loop through the process. They also have a specific color scheme and theme, so abiding to those guidelines will be something that is doable on our end. It is super interesting to see how they brand their organization.
During the interview, we learned more about what kind of information nonprofits collect and who their clients are (in this case, board-members and donors/prospective donors being the main ones). We had never spoken to executives from a nonprofit before, so it was interesting to learn about how their organization is very data-heavy and how they rely on data being an indicator of performance so they can determine which projects to fund.
Overall, the organization, Patti, and Annie want to show how Women’s Foundation Boston is utilizing the money and resources provided by donors to make an impact on the community.
Upon initial observation we were able to gain important insights from the data. The different files we were given to work with demonstrate impacts in both qualitative and quantitative measures. Below are five visualizations that give us a better understanding of trends and patterns within the data. For making initial observations, it was most effective to implement the quantitative data given to us to produce intuitive visualizations. Our initial visualizations focus mainly on impact category, participants funded, and focus area. We can look at these visualizations individually or compare them to make observations about trends for what categories and focus areas are a focal point of the organization, which can help WFB understand if impact results align with their goals and values.
Our main findings were around demographic data and program focus area. We found that WFB tends to fund the most participants in elementary school leadership and mentorship programs. The most common impact category is “Confidence and Development Building,” which seems to align with the previous finding. Our observations also allowed us to see that the most prominent focus area is ‘Leadership/Mentoring’. It was noted that the impact category ‘Confidence and Development Building’ falls under the focus area of ‘Leadership/Mentoring’.
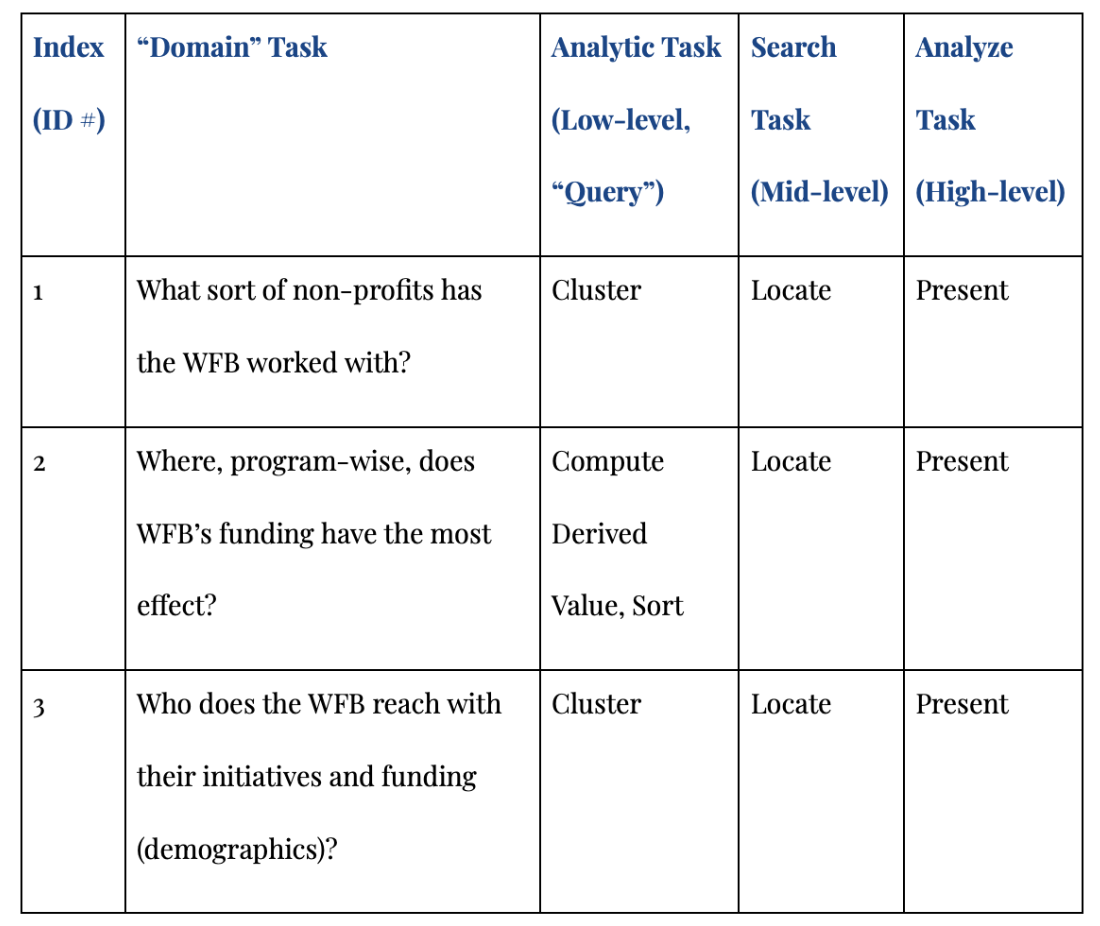
The tasks we chose to prioritize were ‘Where, program-wise, does WFB’s funding have the most effect?’ and ‘Who does the WFB reach with their initiatives and funding (demographics)?’. Our visualizations aim to show on a geographic level where WFB’s funding has a greater effect by displaying points on a map to show a user where funded programs tend to be more concentrated. By allowing the user to hover over the counties within Massachusetts to provide general information about organizations and total participants in that area. A user can attain more in depth information by hovering over and clicking on each dot on the map, which is representative of an organization funded by WFB. Another key component in answering the question ‘who’ comes with our color selection dropdown which allows us to choose what variable is being encoded.
We chose the choropleth map design because it was an effective way to visualize which counties are most affected by WFB. Since we are making it interactive, the user can select a county to see subsets of the data such as stage of life demographics. This essentially means we can visualize more of the data allowing us to tell a fuller story and further understand the trends within it.
MA Choropleth Map and Bar Chart
Below shows an interactive choropleth map displaying the total participants funded in each Massachusetts county by WFB. When you click on a county of your choice, a respective bar chart will display the stage of life demographics that have been funded in that county. Click on the legend to highlight the specific program you are interested in. Additional details can be seen through the details-on-demand feature when you hover over a program.
Arguably the most valuable experience we gained throughout the course of this project was the experience of working with a local non-profit and what it will be like to work in the field in the future. We learned how data is maintained within a local non-profit and gained an idea of the process from data to website visualizations, starting with extensive data cleaning and going all the way to adding interactive visualizations to this website. We also gained valuable experience collaborating using version control software (Git) and communicating with non-technical people. Throughout this project (and the course as a whole) we’ve gained a more complete idea of what makes a visualization compelling, informative, and useful.
In terms of the visualizations, we found that many more participants are funded in Suffolk county than in other counties, but there are a breadth of programs across Massachusetts. It was also interesting that elementary-age programs are the most funded, followed by professional programs.
Working with the Women’s Foundation of Boston was a valuable experience in terms of technical and soft skills, and gave us a good picture of what it’s like to work as a data visualization specialist.